Achievements
-
BUYMA Registerd Members
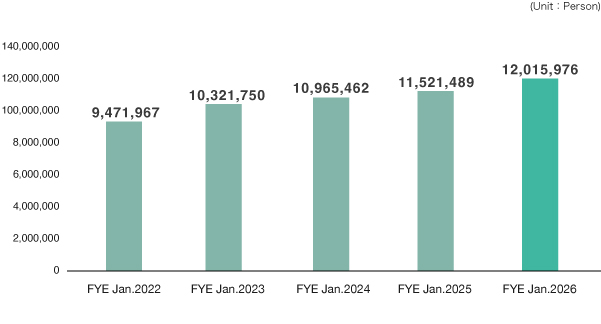
FYE Jan 2022 FYE Jan 2023 FYE Jan 2024 FYE Jan 2025 FYE Jan 2026 9,471,967 10,321,750 10,965,462 11,521,489 12,015,976 -
BUYMA Active Members
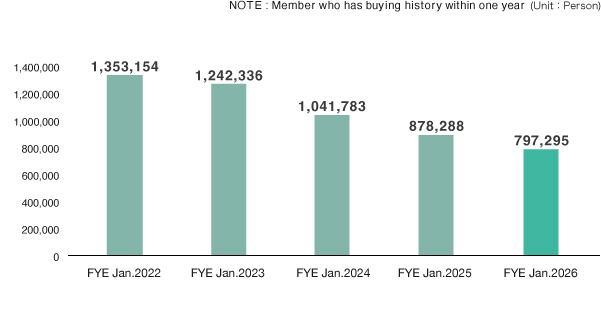
FYE Jan 2022 FYE Jan 2023 FYE Jan 2024 FYE Jan 2025 FYE Jan 2026 1,353,154 1,242,336 1,041,783 878,288 797,295 -
BUYMA Overall trading volume
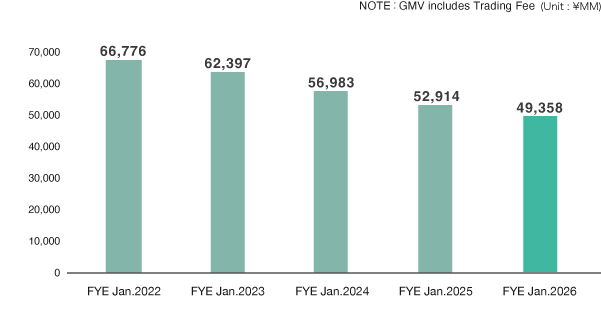
FYE Jan 2022 FYE Jan 2023 FYE Jan 2024 FYE Jan 2025 FYE Jan 2026 66,776 62,397 56,983 52,914 49,358 -
BUYMA Number of Transactions
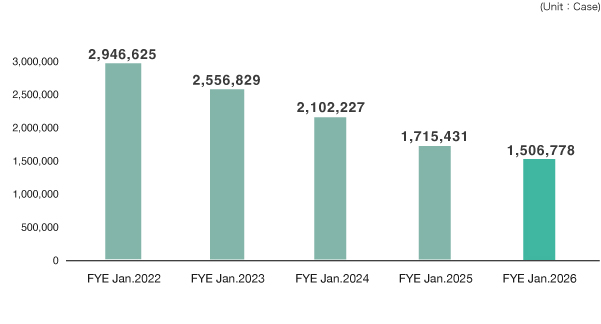
FYE Jan 2022 FYE Jan 2023 FYE Jan 2024 FYE Jan 2025 FYE Jan 2026 2,946,625 2,556,829 2,102,227 1,715,431 1,506,778 -
Revenue

FYE Jan 2022 FYE Jan 2023 FYE Jan 2024 FYE Jan 2025 non-consolidated basis FYE Jan 2025 consolidated basis FYE Jan 2026 non-consolidated basis FYE Jan 2026 consolidated basis 7,616 6,868 6,203 5,645 5,928 5,375 6,295 -
Total net assets/Total assets
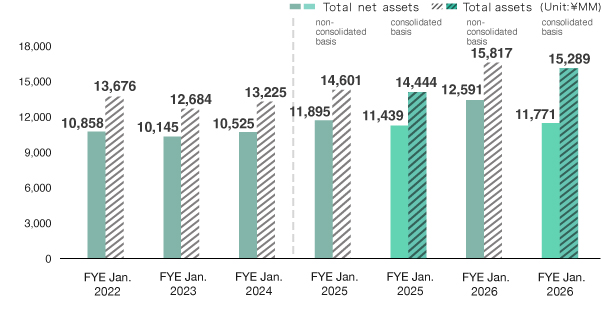
FYE Jan 2022 FYE Jan 2023 FYE Jan 2024 FYE Jan 2025 non-consolidated basis FYE Jan 2025 consolidated basis FYE Jan 2026 non-consolidated basis FYE Jan 2026 consolidated basis Total net assets 10,858 10,145 10,525 11,895 11,439 12,591 11,771 Total assets 13,676 12,684 13,225 14,601 14,444 15,817 15,289 -
Ordinary Income
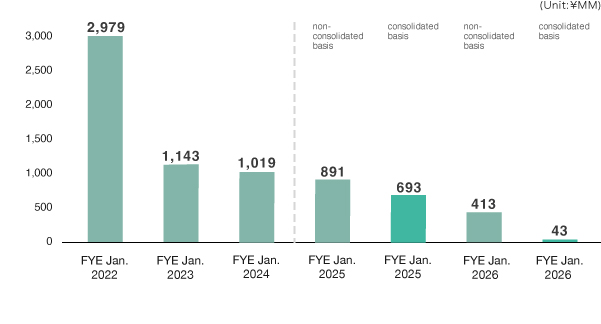
FYE Jan 2022 FYE Jan 2023 FYE Jan 2024 FYE Jan 2025 non-consolidated basis FYE Jan 2025 consolidated basis FYE Jan 2026 non-consolidated basis FYE Jan 2026 consolidated basis 2,979 1,143 1,019 891 693 413 43 -
Net Profit
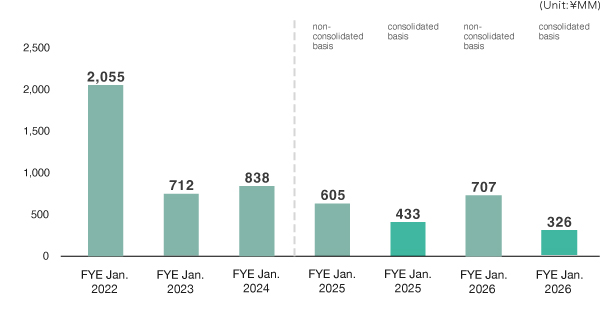
FYE Jan 2022 FYE Jan 2023 FYE Jan 2024 FYE Jan 2025 non-consolidated basis FYE Jan 2025 consolidated basis FYE Jan 2026 non-consolidated basis FYE Jan 2026 consolidated basis 2,055 712 838 605 433 707 326 -
Net asset worth per share

FYE Jan 2022 FYE Jan 2023 FYE Jan 2024 FYE Jan 2025 non-consolidated basis FYE Jan 2025 consolidated basis FYE Jan 2026 non-consolidated basis FYE Jan 2026 consolidated basis 259.80 253.77 264.26 298.80 287.11 316.34 295.34 -
Earnings per share
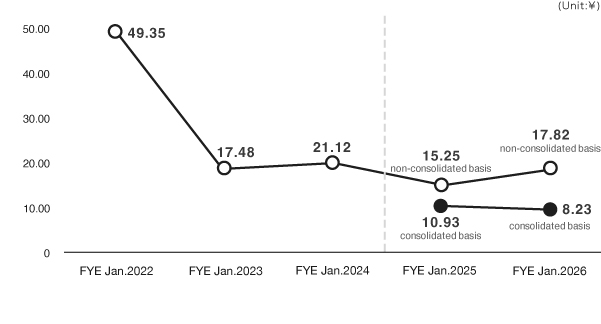
FYE Jan 2022 FYE Jan 2023 FYE Jan 2024 FYE Jan 2025 non-consolidated basis FYE Jan 2025 consolidated basis FYE Jan 2026 non-consolidated basis FYE Jan 2026 consolidated basis 49.35 17.48 21.12 15.25 10.93 17.82 8.23
*Enigmo Inc. conducted a 5-for-1 stock split effective on August 1, 2019. The above graphs of “Net asset worth per share” and “Earnings per share” are retroactively adjusted to reflect the reverse stock split and the stock consolidation.
*Enigmo Inc. has adopted the “Accounting Standard for Revenue Recognition” (ASBJ Statement No.29, March 31, 2020) and other standards since the beginning of the first quarter of the fiscal year ending January 31, 2023, and the respective figures reported in the financial results for the Fiscal Year Ended January 31, 2023, show the amounts after which the above-mentioned accounting standard is applied.