Achievements
-
BUYMA Registerd Members
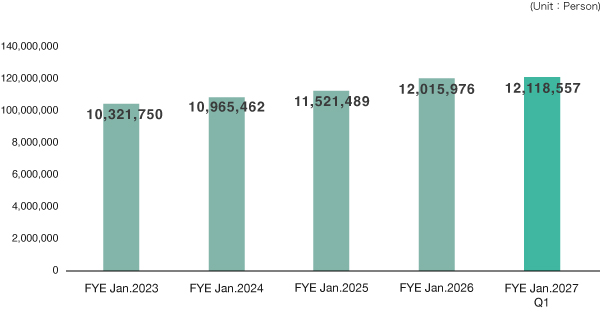
FYE Jan 2023 FYE Jan 2024 FYE Jan 2025 FYE Jan 2026 FYE Jan 2027 Q1 10,321,750 10,965,462 11,521,489 12,015,976 12,118,557 -
BUYMA Active Members

FYE Jan 2023 Q1 FYE Jan 2024 Q1 FYE Jan 2025 Q1 FYE Jan 2026 Q1 FYE Jan 2027 Q1 1,332,762 1,207,646 987,505 857,956 775,724 -
BUYMA GMV

FYE Jan 2023 FYE Jan 2024 FYE Jan 2025 FYE Jan 2026 FYE Jan 2027 Q1 Q1 14,989 14,118 12,349 11,744 10,292 Full fiscal year 62,397 56,983 52,914 49,358 – -
BUYMA Number of Transactions
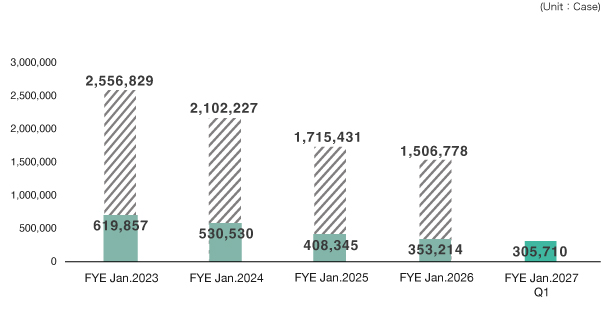
FYE Jan 2023 FYE Jan 2024 FYE Jan 2025 FYE Jan 2026 FYE Jan 2027 Q1 Q1 619,857 530,530 408,345 353,214 305,710 Full fiscal year 2,556,829 2,102,227 1,715,431 1,506,778 – -
Revenue
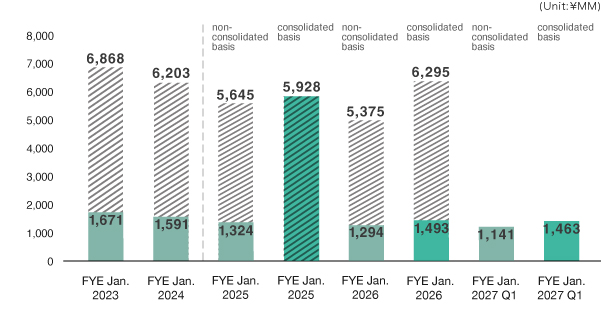
FYE Jan 2023 FYE Jan 2024 FYE Jan 2025
non-consolidated basisFYE Jan 2025
consolidated basisFYE Jan 2026
non-consolidated basisFYE Jan 2026
consolidated basisFYE Jan 2027
non-consolidated basis
Q1FYE Jan 2027
consolidated basis
Q1Q1 1,671 1,591 1,324 5,928 1,294 1,493 1,141 1,463 Full fiscal year 6,868 6,203 5,645 5928 5,375 6,295 – – -
Total net assets/Total assets

FYE Jan 2022 FYE Jan 2023 FYE Jan 2024 FYE Jan 2025
non-consolidated basisFYE Jan 2025
consolidated basisFYE Jan 2026
non-consolidated basisFYE Jan 2026
consolidated basisFYE Jan 2027
non-consolidated basis
Q1FYE Jan 2027
consolidated basis
Q1Total net assets 10,145 10,525 11,895 11,439 12,591 11,771 11,364 10,495 Total assets 12,684 13,225 14,601 14,444 15,817 15,289 14,146 13,579 -
Ordinary income
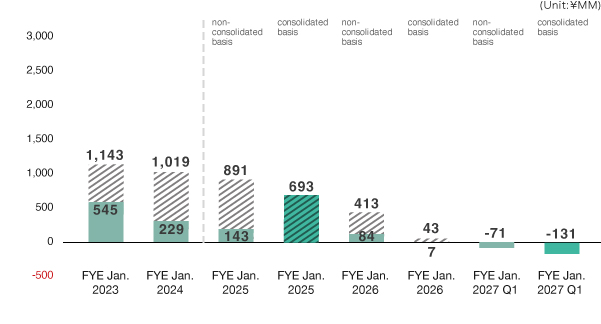
FYE Jan 2023 FYE Jan 2024 FYE Jan 2025
non-consolidated basisFYE Jan 2025
consolidated basisFYE Jan 2026
non-consolidated basisFYE Jan 2026
consolidated basisFYE Jan 2026
non-consolidated basis
Q1FYE Jan 2026
consolidated basis
Q1Q1 545 229 143 693 84 7 -71 -131 Full fiscal year 1,143 1,019 891 693 413 43 – – -
Net Profit

FYE Jan 2023 FYE Jan 2024 FYE Jan 2025
non-consolidated basisFYE Jan 2025
consolidated basisFYE Jan 2026
non-consolidated basisFYE Jan 2026
consolidated basisFYE Jan 2027
non-consolidated basis
Q1FYE Jan 2027
consolidated basis
Q1Q1 381 151 99 433 174 77 158 101 Full fiscal year 712 838 605 433 707 326 – – -
Net asset worth per share
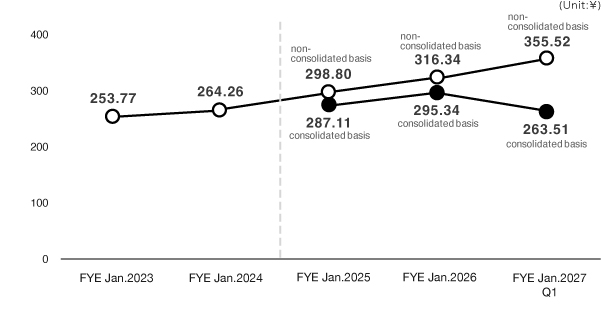
FYE Jan 2023 FYE Jan 2024 FYE Jan 2025
non-consolidated basisFYE Jan 2025
consolidated basisFYE Jan 2026
non-consolidated basisFYE Jan 2026
consolidated basisFYE Jan 2027
non-consolidated basis
Q1FYE Jan 2027
consolidated basis
Q1253.77 264.26 298.80 287.11 316.34 295.34 355.52 263.51 -
Quarterly Earnings Per Share
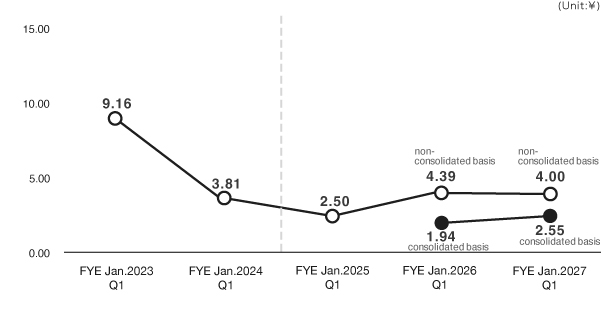
FYE Jan 2023 Q1 FYE Jan 2024 Q1 FYE Jan 2025 Q1 FYE Jan 2026 Q1
non-consolidated basis
Q1FYE Jan 2026 Q1
consolidated basis
Q1FYE Jan 2027 Q1
non-consolidated basis
Q1FYE Jan 2027 Q1
consolidated basis
Q19.16 3.81 2.50 4.39 1.94 4.00 2.55
*Enigmo Inc. conducted a 5-for-1 stock split effective on August 1, 2019. The above graphs of “Net asset worth per share” and “Earnings per share” are retroactively adjusted to reflect the reverse stock split and the stock consolidation.
*Enigmo Inc. has adopted the “Accounting Standard for Revenue Recognition” (ASBJ Statement No.29, March 31, 2020) and other standards since the beginning of the first quarter of the fiscal year ending January 31, 2023, and the respective figures reported in the financial results for the Fiscal Year Ended January 31, 2023, show the amounts after which the above-mentioned accounting standard is applied.